3-1 Earthquakes
Earthquakes happen where adjacent parts of the Earth’s crust are moving in different directions relative to one another. In most cases, that is near to a plate boundary. As shown on Figure 6.1.1 in the textbook, the crustal rocks on either side of a plate boundary are typically locked together, meaning the rocks along the boundary are not moving, even though the plates are moving. This results in deformation of the rock near to the boundary. An earthquake is what happens when the stress of that deformation is greater than the strength of the rock, which leads to breaking and movement of the rock on either side of the plane of breakage. That plane of breakage, or rupture surface, is the area over which an earthquake takes place, as is illustrated on Figures 6.1.2 and 6.1.3.
Figure 6.1.4 illustrates the concept that medium and large earthquakes are not just single events but include many small ruptures that take place over seconds or minutes within the area of the rupture surface. These multiple ruptures take place as a cascade of aftershocks, following the main or first shock, and as described in the textbook, that cascade of events is largely due to stress transfer.
Stress transfer, which is illustrated on Figure 6.1.5, is what happens following the movement of rock on one part of a fault. This releases the stress at that location, but some of that released stress energy is then transferred to other parts of the same fault. This happens on a macro scale, as shown on Figure 6.1.5, but it also happens on a much smaller scale. Each of the dots of Figure 6.1.4 represents a tiny earthquake, each of which released some stress and also transferred some stress to another part of the fault plane, adding to the stress there and triggering one or more of the other tiny earthquakes that made up the whole earthquake. All of that took seconds.
Please read Box 6.1 Episodic Tremor and Slip in the textbook, especially if you live anywhere near to southwestern British Columbia, or within western Washington or Oregon. Episodic tremor and slip is an important part of the way the rocks on either side of a plate boundary move, and there is a stress-transfer aspect of that process which has implications for the next major earthquake on the Cascadia subduction zone.
Earthquakes and Plate Tectonics
Section 6.3 in the textbook provides an overview of the distribution of earthquakes with respect to plate boundaries and plate-boundary processes at divergent boundaries, transform boundaries, and subduction boundaries. Figure 6.2.4 is particularly important because it illustrates the occurrence and distribution of two very different types of earthquakes. The yellow and red dots represent the small earthquakes that took place over a period of several years (up to 2009) within the crust of the over-riding North America Plate and the crust of the subducting Pacific Plate. These quakes resulted from the elastic deformation of those plates caused by locking along the plate boundary. It is probable that many of these small earthquakes resulted in the transfer of stress to the locked plate boundary. The white dots represent the hundreds of small earthquakes that happened over less than a minute in April 2009, when there was displacement of a metre or two along the actual plate boundary, all adding up to a magnitude 6.9 earthquake.
Box 3-1 Lion’s Gate Bridge as a Model for Elastic Deformation, Stress Transfer and Aftershocks
Watch the following video as a model for elastic deformation, stress transfer and aftershocks.
Section 6.4 of the textbook is about the two main ways of measuring earthquakes, one being “magnitude”, which is an estimate of the amount of energy released, and the other being “intensity”, which is an evaluation of what people felt and what damage was done. Every earthquake has only one magnitude, although there are different ways to estimate it, and they are likely to give slightly different numbers. On the other hand, intensity varies widely, with distance from the epicentre and depending on the sort of geological material that is present beneath the surface. While magnitude is always widely reported by the press, intensity is actually a much more useful measure of the risk from an earthquake.
It’s useful to understand the different ways of estimating earthquake magnitude, as summarized on Table 6.3.1 in the textbook.
Exercise 3-1 Moment Magnitude Estimates from Earthquake Parameters
Please complete Exercise 6.2 Moment Magnitude Estimates from Earthquake Parameters in the Environmental Geology textbook.
As already noted, intensity is affected by distance and by the type of material underneath, and while it might be easy to understand why distance matters, the importance of the type of material may not be so obvious.
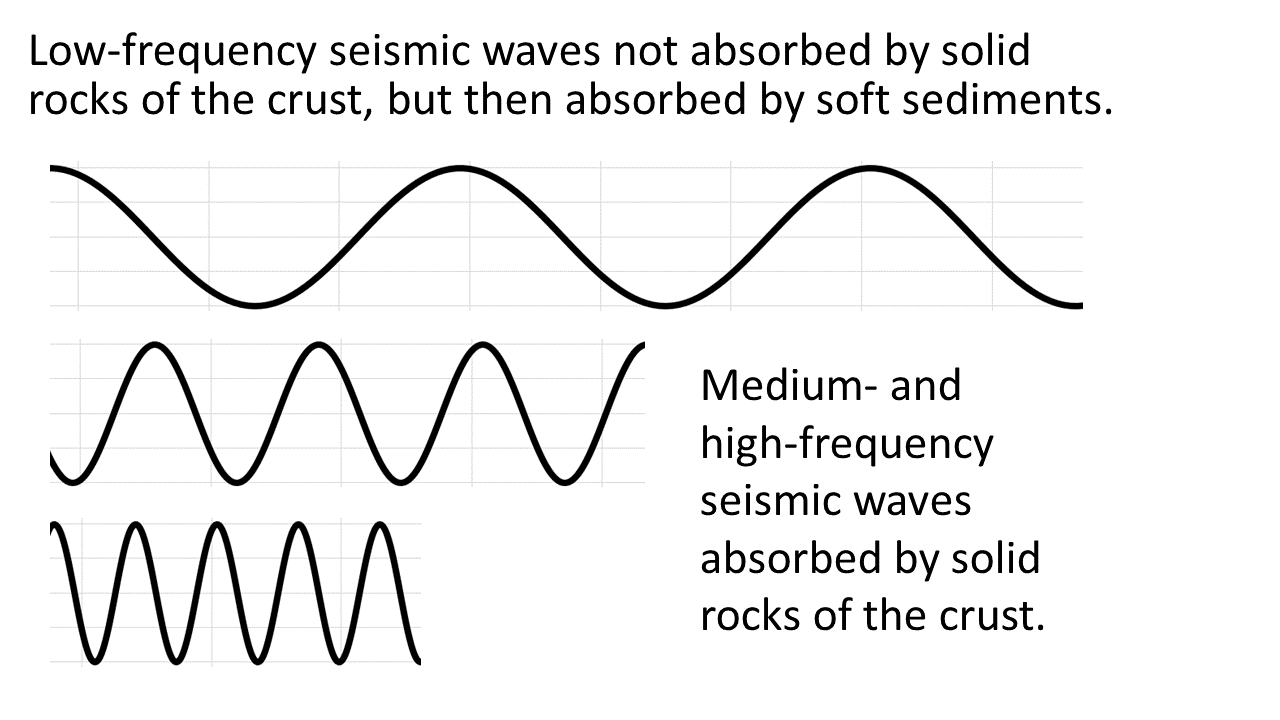
When an earthquake happens, the seismic waves produced have a wide range of frequencies. The energy of the higher frequency (faster vibrating) waves tends to be absorbed by the solid rock of the crust, and so they don’t travel that far, while the lower frequency waves (with periods slower than 1 second) pass through the solid rock without being absorbed but are eventually absorbed by soft sediments that have a lower (slower) natural vibration frequency (Figure 3-1). When that happens, the seismic shaking is amplified within those sediments, and anything built on the sediments will be more vulnerable to damage than something situated on solid rock.
Exercise 3-2 Harmonics Experiment
- Find a wire coat hanger and take it apart. (Sorry, you’ll likely not be able to hang your coat on this one anymore!)
- Stretch it out as straight as you can.
- Get some pliers and grip one end of the wire tight so it won’t slip. (Don’t worry, if you don’t have any pliers, you can just hold it tight in your hand).
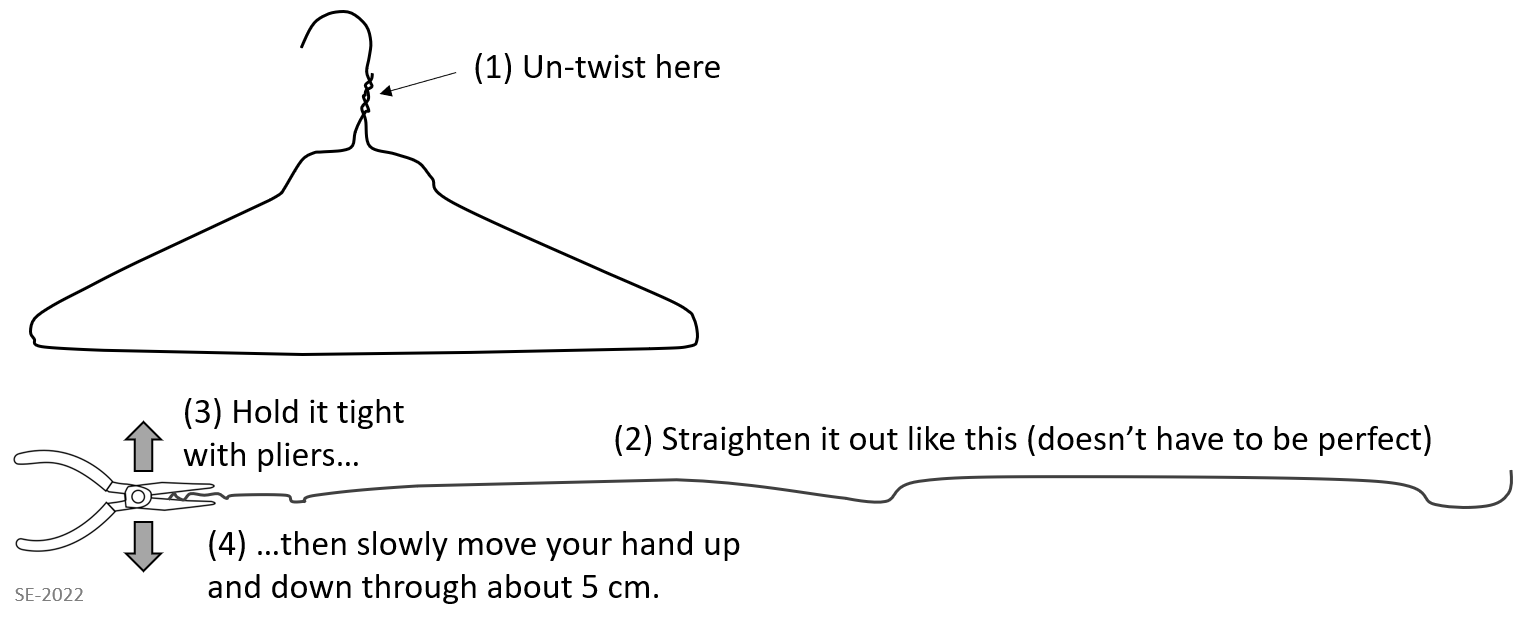
Figure 3-2 Coat Hanger Harmonics - While gripping the pliers (or just the wire), move your hand up and down through about 5 cm, very slowly, at about 30 beats per minute. (Use an online metronome, such as the one at Musicca to help you time this).
- Stop, and then start moving your hand up and down a little faster, about once every second (60 beats/minute).
- Stop, and then start moving your hand up and down a little faster, about 90 beats/minute.
- Stop, and then start moving your hand up and down faster still, about 120 beats/minute.
- Stop, and then start moving your hand up and down a lot faster, about 240 beats/minute.
Hopefully you noticed that at the slow rate, the far end of the wire moved just about as much as your hand did (about 5 cm), but that as you sped up (might have been around 90 beats/minute) the far end started moving a lot more (through 40 to 50 cm maybe), and then as you sped up even more, those big vibrations stopped. Whatever rate that was that gave you the big vibrations is the natural harmonic frequency of the wire (the rate that it wants to vibrate at), and your small input got amplified because you were reinforcing that natural frequency. This is what happens to a body of soft sediments when the frequency of seismic waves matches their harmonic frequency (its typically around 2 seconds or 30 beats/minute).
Soft sediments that are saturated with water are subject to liquefaction during seismic shaking. Liquefaction can exacerbate the risks associated with shaking and can lead to sinking and collapse of buildings (see Figures 6.4.6 and 6.4.7 in the textbook).
Exercise 3-3 Liquefaction Experiment
Try Exercise 6.4 Creating Liquefaction and Discovering the Harmonic Frequency in the Environmental Geology textbook.
Box 3-2 The Pachena Bay Tsunami
Watch the Pachena Bay tsunami video to better understand the process of tsunami formation, and the impacts of the 1700 tsunami on the Huu ay aht people of Vancouver Island.
You can also view the presentation as a pdf (some functionality may be lost): The Great Cascadia Earthquake and Tsunami of January 26th, 1700
As described in the first part of section 6.5 of the textbook, we do not yet know how to predict earthquakes, and although you may have heard of some techniques that are promising, such as watching animal behaviour, or measuring magnetic fields or water levels in wells, none of them has been shown to be consistently useful—relying on them would do more harm than good. As described in the textbook, the risks caused by tsunami waves can be much higher than those related to earthquake shaking. This is true for the devastating 2004 Sumatra earthquake (Figure 6.4.12) and also for the 2011 Tohoku earthquake in Japan (Figure 6.4.3). It also applies to the 1700 Cascadia Earthquake. We don’t have written reports of the effect of that earthquake, but there is an account of the event that has been passed down through the generations of the Huu-ay-aht First Nations on the west coast of Vancouver Island, as summarized in Box 3-2 above.
Instead of trying to predict actual earthquakes, the focus has shifted to estimating the likelihood of an earthquake happening over a coming period of time in a specific region (as shown on Figure 6.5.2), and on ensuring that we are prepared for that in a variety of ways. Those ways include, but are not limited to, the following:
- Ensuring that transportation infrastructure can withstand predicted earthquake effects.
- Ensuring that energy infrastructure (power stations, pipelines and power lines) can withstand earthquake effects.
- Ensuring that buildings (hospitals, schools, offices, and also homes) can withstand earthquake effects.
- Ensuring that we are all personally prepared to survive the aftermath of an earthquake, which might mean having our own emergency food and water that could last a few weeks.
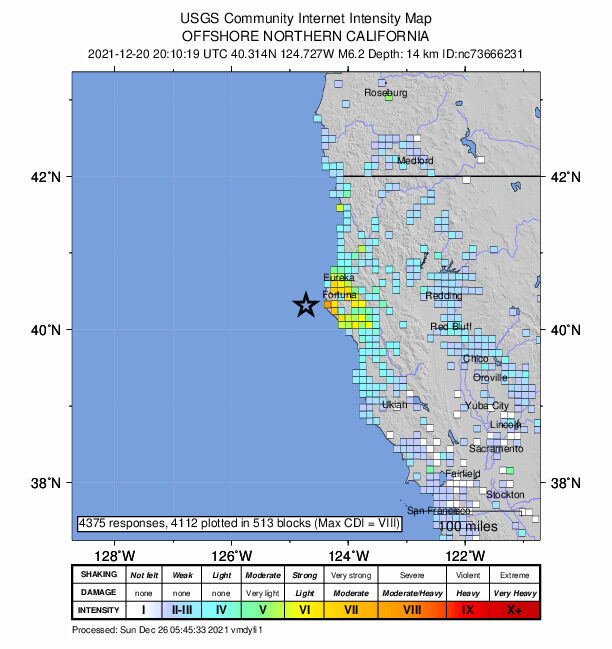
While we can’t predict when an earthquake will happen, we are getting better at providing warning to utilities, businesses, and the public when one has actually happened. One such warning system is illustrated on Figure 6.5.3. Another one—known as ShakeAlert—has been established all along the western coast of the United States and that system provided its first actual warning to the public just after noon on December 20th, 2021. A medium-sized (M6.2) earthquake occurred on the offshore extension of the San Andreas fault about 50 km from the coast of California. Its P waves were detected by on-shore seismometers. The signals were quickly processed by the ShakeAlert system and a warning was issued to the phones and computers of ShakeAlert subscribers in the region, giving those nearest to the epicentre about 5 seconds of warning before the arrival of the S waves, and those a little farther away (but still in areas with Mercalli intensities of around V; see Figure 3-3 below) about 10 seconds of warning. That amount of time is enough for utilities to shut down critical systems, and for individuals to take cover.
Imagine that you have just heard that a significant earthquake has occurred, and you have 10 seconds before the strong shaking reaches you. What would you do to protect yourselves and others around you? (10 seconds is about how long it takes to read those two sentences.)
