5-2 Geological Implications of Climate Change
The Earth’s climate is warming—much faster than at almost any other time in the past—and that change is affecting almost all of the Earth’s systems and most human activities. The direct effects include extreme heat, punishing drought, intense wind and rain, and even anomalous cold spells and snowstorms. The indirect effects include devastating wildfires, accelerating melting of glaciers and sea ice, destabilization of frozen soil and of slopes, and disruption of ecosystems. Chapter 15 of the textbook is focused on how the various changes to our climate are affecting geological processes and Earth systems, and of course, us.
Section 15.1 includes a summary of the nature of temperature increase over the past century. While the global average temperature increase has been in the order of 1°C since 1960, that increase has not been even across different parts of the world. Land areas have warmed more than ocean areas, and the northern part of the northern hemisphere has warmed more than anywhere else (Figure 15.1.2)—by as much as 3°C since 1979. Those higher temperatures have led to drought conditions in many regions because of enhanced evaporation, and also to rapid melting of glacial ice—especially of Arctic Ocean sea ice. The melting of ice on both land and water has created albedo feedbacks that have resulted in more warming, and that is part of the reason that the Artic has warmed so much more than the rest of the planet.
As illustrated on Figure 15.1.3 in the textbook, higher temperatures have also led to greater precipitation in some regions, in part because the Earth’s warmer atmosphere can hold more moisture. This has contributed to an increased risk of flooding and slope failure. And, of course, a warmer atmosphere means a warmer ocean. Although it takes a very long time for the vast thermal mass of the ocean to change, there has been an average sea-surface temperature increase of about 0.6°C since 1960 (Figure 15.1.4). As we’ll see later, that additional ocean heat has significant implications for the strength of storms that pass from the sea to the land.
A warming climate during a glacial period (which is what we are still in) has special geological implications and some of these are discussed in section 15.2. The first of these is the albedo-change issue (as noted above) which provides a strong feedback to warming (or to cooling). Another is the gases that are sequestered in soils, wetlands, and permafrost during cold periods, and then released during melting or destabilization of permafrost (see Figure 15.2.8 and 15.2.9) or the drying of wetlands. A third implication is the destabilization of steep slopes which can result from glacial recession. This illustrated is on Figures 5.2.5 and 5.2.6 for the Tyndall Glacier in Alaska, but also likely applies to the multi-modal failure at Elliot Creek, British Columbia, that took place in November 2020, described in Box 5.1 The November 2020 Mass Wasting Events at Elliot Creek, BC in section 5.2 of the textbook. And of course, a fourth implication is sea level rise, which although slow at present, will likely render hundreds of the world’s coastal cities (including most of the world’s largest cities) uninhabitable within a few centuries.
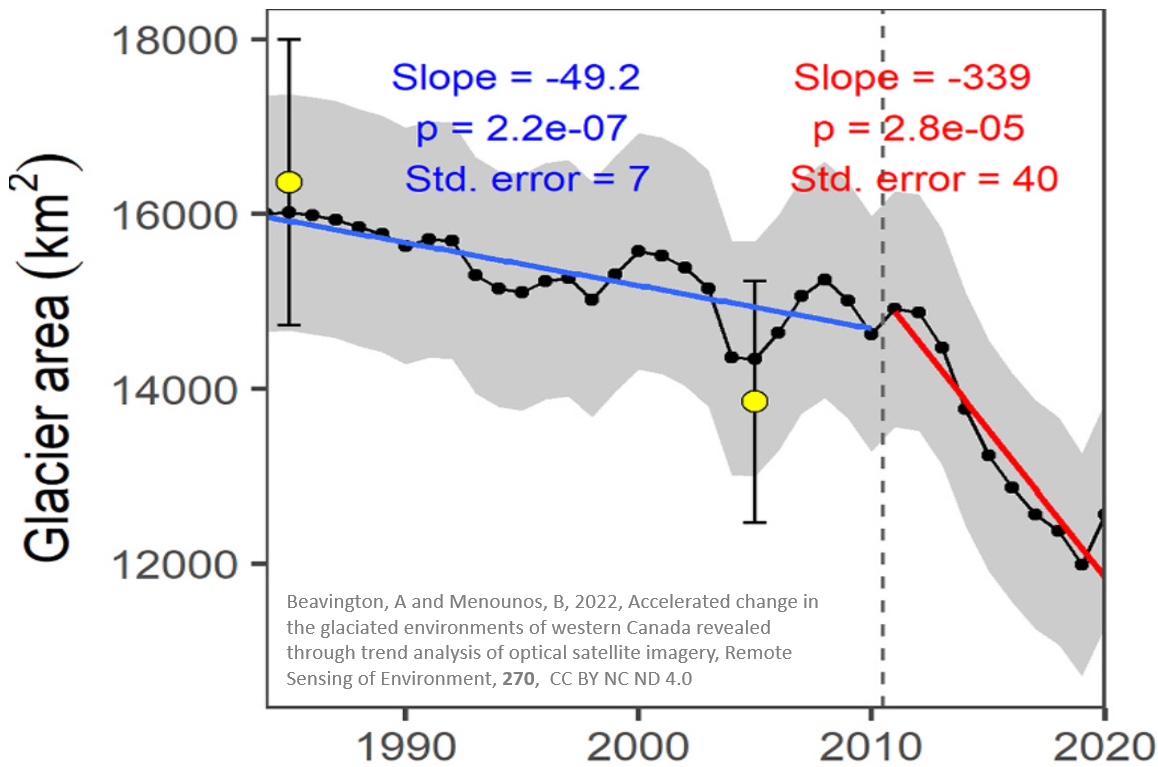
A recently published study shows an alarming increase in the rate of glacial melting over the past decade. The research involved analysis of the areas of thousands of glaciers in British Columbia and Alberta using satellite images collected over 36 years. This trend, which is illustrated on Figure 5-1 below, shows that the rate of glacier area loss increased from 49 km2/year from 1984 to 2010, to 339 km2/year in the period 2010 to 2020. The loss of mass from alpine glaciers contributes to sea level rise, and also has implications for various climate feedbacks.
An important implication of sea level rise, and one that will become an issue long before cities are flooded, is the salination of coastal aquifers. Please complete Exercise 15.2 Groundwater Salinity and Sea Level Rise in the textbook to ensure that you understand the concept of coastal aquifer salination.
The link between climate change and extreme weather events—such as tropical storms (e.g., hurricanes)—is discussed in section 15.3 of the textbook. Much of this is a result of the extra heat that is now stored in the surface water of the oceans (see Figure 15.4.1) because the transfer of that thermal energy to the atmosphere is what powers the storms that start on the ocean. The real problems begin when those storms come onto land, and it’s mostly because of how much water they bring with them.
Most of the examples in section 15.3 are about tropical cyclones, but as residents of the Pacific Northwest witnessed in November 2021, atmospheric rivers, which are not spinning storms, can be nearly as bad. This is illustrated in the attached video:
You can also view the presentation as a pdf (some functionality may be lost): Atmospheric River: Rain, Flooding and Slope Failures
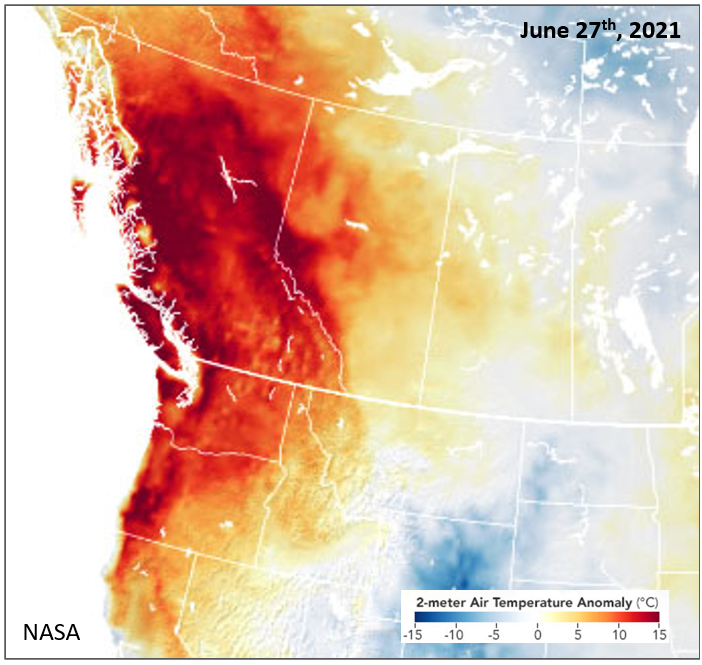
Climate change is starting to bring us another type of hazard: extreme temperature events, and again this was witnessed in the Pacific Northwest region in 2021. Starting in late June and lasting for almost two weeks a high-pressure system trapped heat in the atmosphere in western North America. For part of this time much of British Columbia and Washington, and parts of and Oregon, experienced temperatures between 10° and 15°C above average (Figure 5-2 below).
That heat event, which broke records at many stations, including an all-time high temperature for Canada at 49.6°C, turned out to be deadly. The chief coroner for BC reported 569 heat-related deaths in June, compared with only five heat-related deaths in the previous five years (LaPointe, 2021). Part of the reason for the high death toll is that air-conditioning is relatively uncommon in homes in British Columbia due to infrequent very high temperatures. Western North America wasn’t the only region affected by extreme heat in 2021. There were also deadly heat waves in Eurasia, western Europe and in other parts of North America.
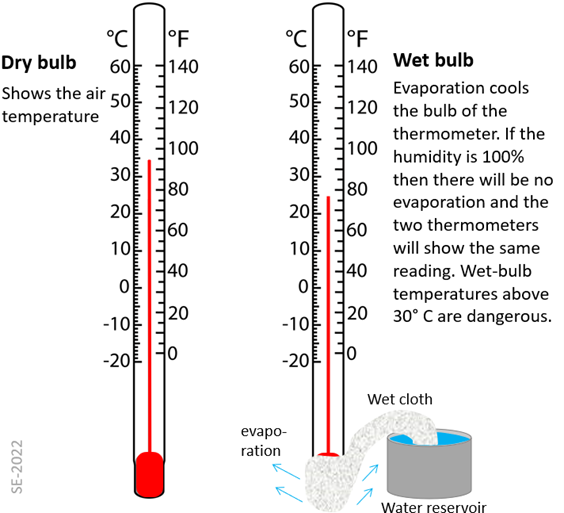
The term “wet-bulb temperature” is becoming more frequently used in the context of heat waves, and so it is useful to know what that means. As shown on Figure 5-3 below, a wet-bulb thermometer is one where the bulb is kept constantly wet (typically with a wet cloth). This water evaporates and the energy taken out of the air to accomplish that cools the bulb (just as evaporation of water from your skin cools you). For this reason, a wet-bulb thermometer almost always shows a lower temperature than an adjacent dry-bulb thermometer. The rate that evaporation can take place around a wet bulb depends on the natural humidity in the air, and so the difference in temperature between a wet bulb and a dry bulb is a measure of that humidity.
When the humidity of the air gets close to 100% the rate of evaporation approaches zero, and so the readings on adjacent wet-bulb thermometers become almost the same. The concept of wet-bulb temperature is illustrated by the coloured lines on Figure 5-4 below. A temperature of 40°C is quite extreme, but as long as the humidity is low (say less than 5 g/kg) and a person has enough water to drink they can stay relatively comfortable (because the wet-bulb temperature will be below 20°C)—in fact more comfortable than someone experiencing just 25°C and 100% relative humidity (20 g/kg). Wet-bulb temperatures between 20° and 25°C are uncomfortable. Wet-bulb temperatures between 25° and 30°C are hazardous and can be deadly for some people. Wet-bulb temperatures between 30° and 35°C are dangerous and can be deadly for many people. Wet-bulb temperatures over 35°C are deadly for almost everyone that isn’t able to find some place cool. Even having ample water to drink and staying wet (unless you can find some cold water to immerse yourself in) will not save you from exposure to a wet-bulb temperature over 35°C.
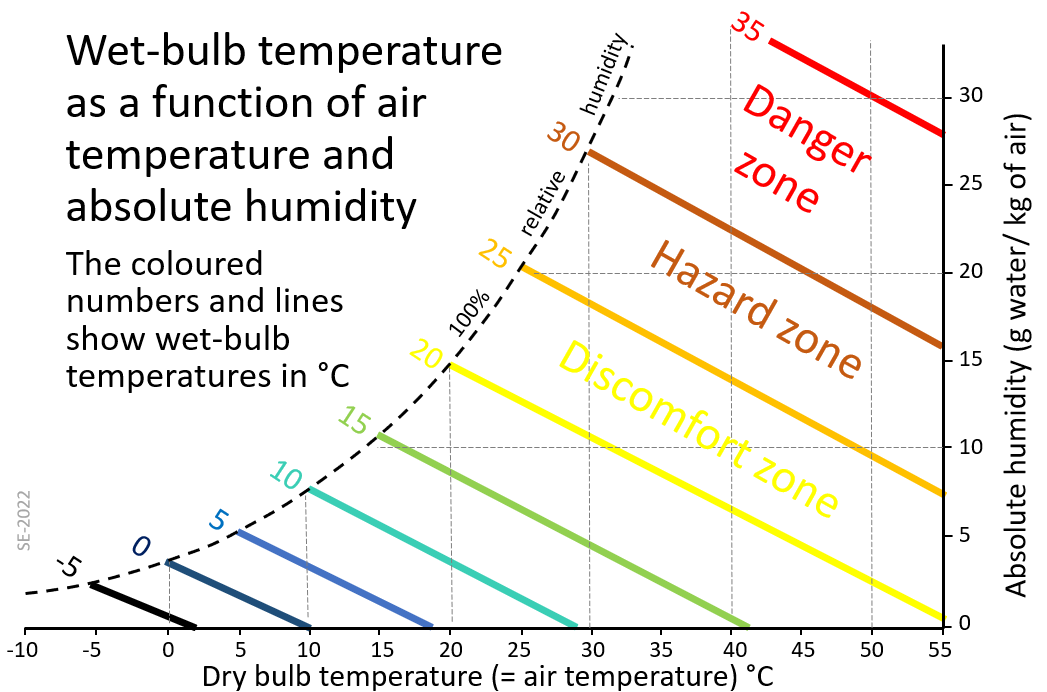
During the June 2021 heat wave in western Canada some of the higher wet-bulb readings were in the range 25° to 30°C and, even then, there were many hundreds of heat-related deaths.
Anthropogenic climate change has significant implications for Earth systems. Some of these have already been noted above, and in other parts of the Course Units, and they are summarized in section 15.4 of the textbook.
Questions to consider:
Complete the following table using either the list of issues in section 15.4, or Figure 15.4.1.
| Climate-change effect | One important way in which that affects Earth systems |
| Atmospheric warming | |
| Higher CO2 levels | |
| Enhanced evaporation | |
| Warmer lake and ocean water | |
| More atmospheric water | |
| Higher ocean CO2 levels |
Anyone that learns about anthropogenic climate change and understands its implications is likely to feel anxious about our future, uncomfortable about their own actions, and angry about the inability of other people to recognize that we have a problem. These reactions may also leave people feeling confused and helpless, unsure of what they should do, concerned that the situation is hopeless, and unable to make changes.
One way to get past those feelings of helplessness is to get involved in some sort of positive action, and section 15.5 of the textbook provides some examples of actions that we can all do to effect change.
The first, and possibly most important action is to become more politically active. That doesn’t mean knocking on doors or giving speeches; it can be as simple as voting, letting others know that you are planning to vote, and letting political candidates and elected politicians know that the climate is an important issue for you (perhaps your most important one!).
Another important action is to exercise your economic muscle. Yes, you have lots! Making changes to your buying habits can make a big difference.
And then finally there are your personal actions and habits. The biggest (and possibly the most difficult) changes that you can make are in how you get around. North Americans are addicted to driving. That’s partly because we are so spread out and also because of the poor state of public transit in most areas, but it’s also a very strong habit. When we have to go somewhere we just naturally hop in the car. We need to try to make using the car the second or third choice after walking, biking, public transit or just not going somewhere. The other simple change that we can all make is in what we eat by choosing foods that are over to the right-hand side of Figure 15.5.3 and reducing our consumption of those on the left-hand side.
Once you have answered the questions at the end of Chapters 14 and 15 in the textbook you should be ready to complete Assignment 5 which you can access and submit through Moodle if you are a registered Open Learning student.
It is now time to schedule your Final Exam. Please see the Final Exam tab in Moodle for instructions on writing your exam.
